


Author: Lasha Arevadze
This article was prepared within the framework of the Strategic Plan Georgia 2020 – Strengthening Public Involvement (ZigB), and published on the Georgia 2020 blog.
In spring 2013, the Georgian government launched a policy of subsidizing agriculture on an unprecedented scale. By the end of next year, the government is expected to have spent a total of GEL 367 million alone on the Small Farmer Assistance Program - its largest subsidy program.
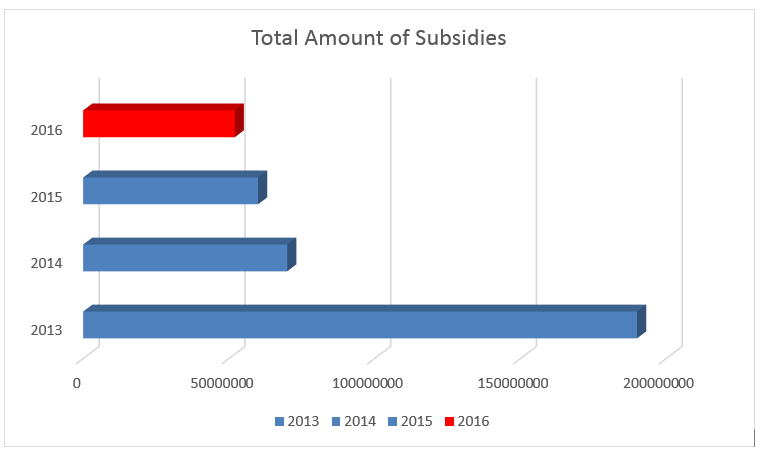
(Figure 1.) State funds allocated for the Small Farmers Assistance Project in 2013-2016. Source: Ministry of Finance
More than half (52%) of all the program funding was spent in the first year. This was followed by a continuous reduction of subsidy amounts for all beneficiaries. Initially, the program included the following components:
• A combined agricultural card of GEL 510 per hectare for farmers with 0.25 to 1.25 hectares. (Plowing - GEL 140, loosening – GEL 70, equipment - GEL 300).
• GEL 640 per hectare for farmers with 1.25 to 5 hectares.
The program underwent significant changes every since, and the subsidy amount per hectare was reduced. For example, small farmers with up to 0.25 hectares receive an equipment subsidy of GEL 50, and farmers with up to 1.25 hectares get a plowing voucher of GEL 140.
An intervention of this scale calls for an effectiveness analysis and program evaluation. However, such analysis is being hindered by the lack of a database on the income and behavior of program beneficiaries. Our analysis is therefore based solely on macroeconomic data (changes in gross agricultural production, productivity, and household income), which is insufficient for identifying the direct effect of supporting small farmers.
Below we will discuss the argumentation behind the narratives used to justify the intervention (e.g. combating rural poverty, small agricultural output, etc.), whether the program was designed in a way to eliminate these problems, and, finally, the results of the program in its final year.
Reasons for Intervention
According to the UNDP’s chief economist Thangavel Palanivel, “growth is inclusive when it takes place in the sectors in which the poor work, occurs in places where the poor live, uses the factors of production that the poor possess, and reduces the prices of consumption items that the poor consume”. [1] The Agriculture Production Index shows that the Georgia saw a decrease in agricultural production between 2003 and 2010, despite an overall economic growth.
(Figure 2)
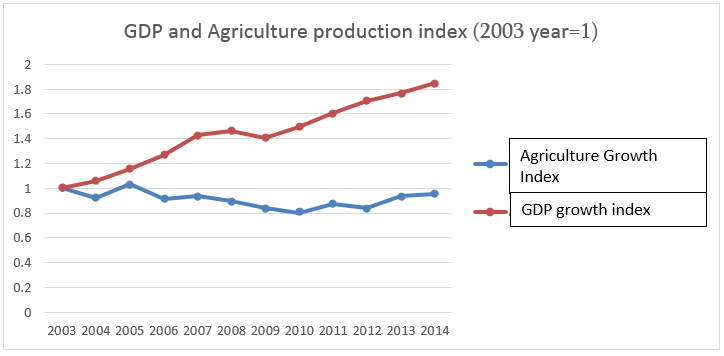
In 2010, the value of agricultural production at constant prices was 20% lower compared to 2003. The same value in 2014 was still 5% lower than 2003. In other words, over the recent years growth did not occur in places where the poor live. Therefore, in order to encourage inclusive growth in the country, emphasis had to be made on agriculture.
However, income from agriculture in rural areas is becoming less important than it was several years ago (see. Figure 3).
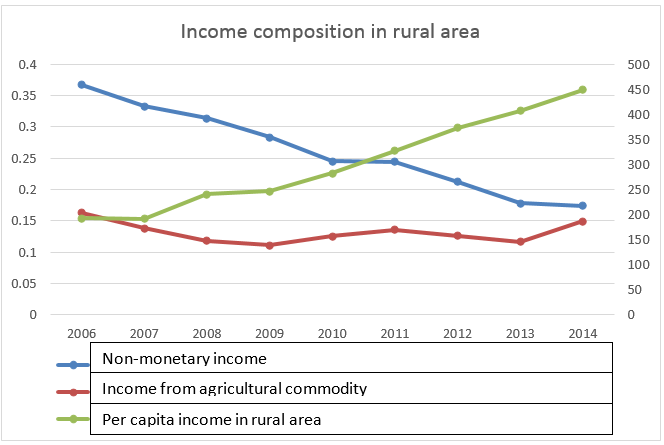
Figure 3. Rural household income composition. Source: National Statistics Office of Georgia.
For example, in 2006, 53% of an average rural household income was composed of non-cash income and income received from the sale of agricultural products. In 2014 this figure dropped to 32%. This means that the rural population found more sources of income in addition to agriculture. Over the years, rural households saw an increase in income from hired labor from 13% to 19% and from pensions and social assistance from 8% to 19%. [2]
The above data suggests that in recent years the agricultural sector (where per capita income is 19% lower than that of urban population) has been steadily declining in its importance for the overall economy. In addition, the rural population has become less reliant on agriculture. However, this does not mean that the social situation has improved in rural areas; on the contrary, the rural population has become even more reliant on social assistance and pensions.
The declining state of agriculture has prepared grounds for an active state intervention with the goal of achieving inclusive growth. The unprecedented scale of intervention in the agriculture sector launched in2013 was a result of this. As mentioned above, the Small Farmers Assistance Program was one of the largest in this regard, however, it was not immediately clear how its design was based on the logic of inclusive growth, and the growth of productive employment. Same can be said regarding its outcomes.
Program design and outcomes
In 1932, when the US government decided to subsidize agriculture, then President Roosevelt's Secretary of Agriculture Henry Wallace explained that the programs were “a temporary solution to deal with an emergency”. [3] This message is important, since it does not consider agriculture subsidization as a foundation of a long-term transition and development, but rather a mechanism for easing the cyclical nature of problems of this sector. In other words, agricultural subsidies are most effective when dealing with short term problems. In Georgia, however, the problems faced by the agriculture sector are mostly structural in nature and associated with low productivity. The solution of these types of problems calls for a change in strategy, specifically, investment in agriculture technology, irrigation systems, and knowledge and qualification of farmers.
The main problem with the subsidy program is the uncertainty regarding its goal. The program uses land ownership as the main criteria for issuing subsidies, and does not consider the farmer’s actual intent of cultivating the land. For example, in 2015 alone, the program subsidized the cultivation of annual crops on more than 340 thousand hectares of land, while only 290 thousand hectares were cultivated in Georgia by all types of farmers: program beneficiaries and others. The program does not require farmers to change their practices. It simply substitutes the expenses that were previous covered by the farmers themselves. Initially, the program was not coupled with any other program aimed at updating equipment and introducing new crop varieties. Other agriculture programs, such as those subsidizing grapes, mandarins or apples also follow the above practice. A program supporting the formation of farmer unions was launched only recently. The experience of other countries shows that the success of subsidy programs largely depends on the existence of and cooperation with other programs in the sector. [4]
The program would be considered successful if it complimented the growth of a farmer’s working or fixed capital and increased production and land cultivation. Without these outcomes the program can be considered a social assistance package. The program essentially allows small farmers to substitute their expenses with the provided subsidy, i.e. driving out private investment. This was the result of the program not being designed with specific goals and needs of the farmers in mind. Analysis of successful examples (e.g. Malawi) [5] shows that subsidy programs are successful when the funding goes to those who would otherwise be unable to procure production factors. Funding everyone regardless of their actual need results in large budget expenditures, smaller subsidy amounts per beneficiary, and driving out of private initiative.
What were the outcomes of this three year long program? In order to better answer this question, we should divide it in two: what impact did it have on agricultural growth? And what impact will it have in the future? Do the outcomes of the program match the declared goal of achieving inclusive growth?
The least we can say about the program is that the intervention was not sustainable, since small farmers will be faced with the same problems next year as they did before the program. The fact that the government decided to extend an initially two year long program one additional year is a good indication of this.
One expected mid-term outcome of the program was the stimulation of small farmer activities and increase of yield. The following figure shows the change in yield on main agricultural crops.
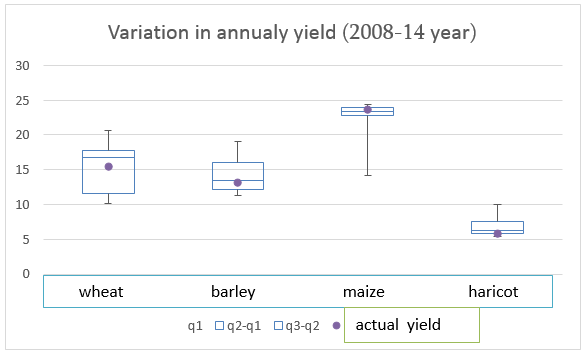
Figure 4. The range of yield per hectare in 2008-2014. Source: National Statistics Office
One indicator that can help quantify the impact of the program on the growth of employment and production agriculture is the increase in yield (it should be noted that other government programs carried out in 2013-2015, like the cheap credit program, also had an effect on employment and production). Figure 4 shows the range of yield per hectare for 4 major crops over a 7-year period [6]. The data shows that the actual yield values almost never exceed the median value (which is most apparent in the case of wheat, where the yield per hectare over the last two years is lower than in the median value of the entire period), suggesting that there was no meaningful growth in yield in recent years. This suggests that the increase in agricultural production in Georgia was mostly due to extensive growth (increase of production factors), rather than the intensive growth of productivity and technological improvement. [7] Achieving growth in this field requires infrastructural improvement coupled with the replacement of less productive plants and animals with more productive ones (the 2011 government program estimated that 70-75% of all livestock in the country was low in productivity).
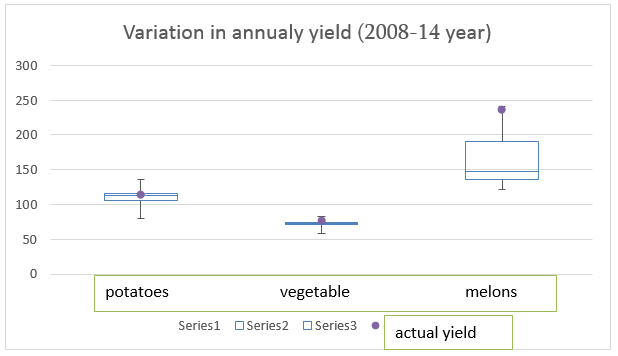
Figure 5. The range of yield per hectare in 2008-2014. Source: National Statistics Office
The situation is slightly different for the three crops in figure 5, with a dramatic increase in yield of melons, watermelons and pumpkins over the last two years.
The fact that agricultural subsidies carry fiscal risks is evident in the case of Georgia. A major criticism of agricultural subsidies is the fact that the programs never end as initially planned. Georgia is no exception. The program was supposed to finish this year, but it has been extended another year (without any evaluation of its outcomes). The problem in terms of fiscal policy is typical – it is impossible to adjust the political costs of any such social program. The result is that the sector was unable to become self-sufficient, sustainable, and achieve a statistically significant growth in productivity. If this program ends next year, the Georgian agriculture sector will face the exact same problems as it did before the program’s launch, without any significant results. Above we used macroeconomic data related to the agriculture sector in order to analyze the outcomes of the subsidy program. This does not allow us to identify the direct effects of the program on the agriculture sector. However, it can still be said that the program was unable to ensure stability, solve structural problems, and remove the need for further subsidies. Therefore, it would be appropriate to say that the program was powerless to support agriculture and was, in fact, a social assistance program.
The opinions expressed in this article belong to the author alone, and do not necessarily reflect the positions of the Institute for Development of Freedom of Information (IDFI), University of Bremen, and the German Foreign Ministry. Therefore, these organizations are not responsible for the content of this article.
References:
[1] Sustainable Development Global Fund, 13 July 2015. http://www.sdgfund.org/what-does-inclusive-economic-growth-actually-mean-practice
[2] National Statistical Office, average monthly income per household in urban and rural areas. http://www.geostat.ge/?action=page&p_id=181&lang=geo
[3] H. Wallace, “A Vision for the 2007 Farm Bill”, June 4, 2007. http://www.oxfamamerica.org/static/media/files/fairness-in-the-fields.pdf
[4] A. Dorward et. al., “Agricultural Input Subsidies for improving Productivity, Farm Income, Consumer Welfare and Wider Growth in Low- and Middle-Income Countries: A Systematic Review”, The Campbell Collaboration, 2013. http://www.campbellcollaboration.org/lib/project/300/
[5] E. Shively et. al., “Measuring the Impacts of Agricultural Input Subsidies in Sub-Saharan Africa: Evidence from Malawi’s Farm Input Subsidy Program”, 2013 http://docs.lib.purdue.edu/cgi/viewcontent.cgi?article=1003&context=gpripb
[6] Figure 4 shows the range of yield for each crop per hectare over a period of 7 years. For example, the yield of wheat ranged from 10 to 20 tons per hectare. The rectangle represents the median yield value +/- 25% of total data. The line inside the rectangle represents the median value. The lines outside the rectangle (above and below) represent the minimum and maximum values for this period. The yellow points represent the average yield per hectare in 2013-2014. In case of wheat, the yellow point falls below the median line, meaning that the average yield in 2013-2014 was lower than the average yield in 2008-2014.
[7] Extensive growth is achieved through simple increase of the factors of production; intensive growth is achieved through a better use of the factors of production.
 Subscribe to Our News

